Understanding Amazon Performance Metrics
Amazon performance metrics are KPIs that help you understand how well your business is doing compared to set benchmarks. By monitoring these indicators closely, you can identify areas for improvement and ensure the success of your Amazon store.
Amazon KPIs provide insights about improving and tracking your progress. You can use the Amazon KPI dashboard on Seller Central to understand your account health and monitor everything from revenue, profits, customer satisfaction, and customer acquisition.
This article describes the most important metrics to measure for Amazon Prime Day so sellers can boost sales and deliver a great customer experience. We’ll also share tips and strategies for improving seller performance metrics.
Before Amazon Prime Day: Preparation Metrics
Days before the Prime Day event, monitor your data every few hours. This will allow you to quickly make any necessary adjustments.
- Inventory performance index (IPI): The IPI measures the health of your inventory in Amazon’s network. It calculates low and excess inventory levels for your SKUs to generate a score between 0 and 1,000. The higher the score, the better. Amazon uses the IPI score to verify that sellers stock the appropriate products in the correct quantities at their warehouses.
- Listing visibility metrics:
- Search ranking: Ensuring your product listings are visible to buyers is crucial.
- Search visibility measures how easily Amazon customers can find your products when they search for specific keywords related to your product. This metric is estimated based on the product’s average page rank and search position.
- Sponsored ad performance: A successful Amazon advertising strategy requires that you regularly monitor your campaigns. Amazon offers various metrics to help sellers gauge ad effectiveness. Here are the top ad performance metrics to keep an eye on before Prime Day:
- Return on Ad Spend (RoAS): RoAS measures campaign performance in relation to your ad spend. It is the amount you earn for every dollar you spend on an Amazon Advertising campaign.
- Cost-Per-Click (CPC): CPC is what you pay for each click on your ads. Paying more per click gets you a better ad position and more clicks. If you have observed that your advertisements are not ranking as well as they used to, it is possible that your bid may be too low.
- Ad Budget: Prime Day is a highly competitive event. If you set your bid caps too low, you’ll be outbid and your ads may not be visible to your customers. Similarly, if you bid too high, you may exhaust your budget rapidly. Prepare your bids and spending leading up to Prime Day to ensure that you don’t exceed your budget limit before the peak shopping hours of 10 AM-11 AM and 8 PM. Keep in mind that the peak shopping times on the East Coast are three hours ahead those on the West Coast.
- Conversion rate: Conversion rate, also known as unit session percentage rate, helps you understand your products’ current performance in conversion to sales relative to ad views and how many people view a product listing.
- Customer feedback: Amazon’s algorithm uses two KPIs to rank your product based on customer feedback: the number of reviews and the review score. Amazon also takes into account the percentage of sales that result in feedback. It is an indication of your product performance.

Get Back the Money You’re Owed from Amazon
During Amazon Prime Day: Real-time Metrics
These are the key metrics that you should keep an eye on during Prime Day:
- Sales velocity: Amazon sales velocity is a metric used to measure a seller’s performance by tracking the number and dollar amount of transactions made in a month. In simpler terms, it determines how fast your products are selling. Having a higher sales velocity improves your product rankings, leading to an increase in sales.
- Buy box percentage: The Buy Box is the white box on the right side of the Amazon product detail page, where consumers can add items to their cart. Since not all sellers are eligible to win the Buy Box, this metric measures how often your product appears in the Amazon Buy Box. Your Buy Box percentage is calculated by dividing the number of times you won the Buy Box by the total number of visitors to your listing. For example, if your listing received 500 visitors and you won the Buy Box 200 times, your Buy Box percentage would be 40%.
The percentage of Buy Box wins depends on page views and Buy Box ownership (meaning the number of people who end up adding your product to their cart). You can invest in Amazon ads to increase your page views. Similarly, the more you own the Buy Box, the more likely customers are to view your offer while you own it. - Session percentage and page view percentage: It’s tough to stand out on Amazon with 2.5 million sellers competing for the attention of millions of shoppers, including 150 million Prime subscribers. Consider these two metrics for measuring the visibility and engagement of your product:
- Session percentage: This metric measures the percentage of customers who purchased a product after visiting its detail page. A low session percentage indicates issues with acquiring the Buy Box or poor listing information for the product. The number of page views you see depends on the time period you choose.
- Page view percentage: Page view percentage refers to the percentage of page views that a specific ASIN receives compared to the total number of page views. Customers may visit a product page multiple times, affecting the efficacy of this metric. For this reason, the session percentage is a more reliable metric to consider.
It’s important to continuously conduct keyword research to achieve a high ranking on Amazon. Use relevant keywords and tailor them for improved visibility, conversions, and relevance.
- Cart abandonment rate: This metric measures the percentage of customers who add items to their online shopping cart but do not complete the purchase. It is calculated by dividing the number of potential shoppers who abandoned their carts after showing interest by the total number of shopping carts created.
Customers abandon their online shopping carts for various reasons, such as a complicated and lengthy checkout process, dissatisfaction with shipping costs and delivery dates, and distrust in checkout security and payment systems.
After Amazon Prime Day: Retrospective Metrics
These are the essential Amazon performance metrics that you must keep a close eye on following Prime Day:
- Total revenue and profit margins: These metrics help you assess the overall success of Prime Day sales. Total revenue refers to the total money you made during a specific time period, i.e., the Prime Day event. You can calculate the actual profit by deducting other expenses, such as promotional and shipping costs, from this amount.
- Return rate: Return rate, also known as the Order Defect Rate (ODR) is a performance metric that measures the quality of the products sold. It is the ratio of the number of orders returned to your total number of orders during a certain time period.
- Repeat customer rate: The repeat customer rate is an eCommerce metric that measures the percentage of customers who purchase from your store more than once during a certain time period (either daily, weekly, or monthly). It indicates customer loyalty to your brand post-Prime Day.
- Performance over time: Measure the success of your Prime Day campaign by monitoring your sales, web traffic, and engagement both during and after the event. Compare Prime Day performance to other shopping events or the previous year’s Prime Day event. You can use this information to make necessary adjustments and improve future campaigns.
Note that there are other Amazon Seller Performance metrics you should closely monitor to achieve long-term and short-term success on Amazon. These are:
- A-to-Z claim
- Contact response time
- Late shipment rate (LSR)
- Valid tracking rate (VTR)
- Pre-fulfillment cancel rate
- Order cancellation
- Negative feedback rate
- Service chargeback rate
Read our guide about how to track your seller performance on Amazon to learn about these seller metrics.
The Role of Amazon Prime Day in Long-term Performance Metrics
Amazon business owners can boost their sales and profits by participating in Prime Day. With millions of Prime members, your products are sure to reach a wide audience. In addition, you can offer exclusive discounts and run special promotions to maximize your sales and attract new customers.
The effect of a Prime Day sales boost can extend beyond the two-day event. You can leverage the increased visibility and higher rankings by optimizing performance metrics and ensuring you have enough stock levels to fulfill growing customer orders after Prime Day. This can help sustain your sales momentum for weeks and months to come.
Tips for Improving Your Amazon Performance Metrics
Here are some useful tips to help you unlock the full potential of your Amazon store.
Improve Inventory Management
Amazon FBA sellers should optimize their inventory management to ensure stock availability during high-demand periods to avoid lost sales. The success of their Amazon business depends on it.
By improving inventory management, sellers can increase sales, prevent out-of-stock situations, and reduce storage fees.
Focus on Strategies to Improve Product Visibility
- Use customer feedback to improve product visibility: Both positive and negative feedback increases customer engagement and trust in your brand. That means you should maintain your positive reviews, answer the negative reviews, and work on improving them.
When looking at Prime Day reviews, which products were hot-ticket items? Think about similar products you can add to the mix, as these will likely help you rank higher in the long run.
Another good practice is to also keep an eye on competitors’ reviews throughout the Prime Day lifecycle. This can help you identify any weak areas in their offerings that you can leverage to improve your own product. - Track KPIs to optimize product pages: As an Amazon seller, you must analyze the data and demographics from your Prime Day event to determine areas of success and areas that need improvement.
- Take note of any rise in new customers and search items during Prime Day and identify the factors that led to these results. These factors could include the usage of social media, offering a discount, and more.
- Review the visibility of your Sponsored Ad campaigns and identify new audiences or keywords to target for your upcoming sales event.
- Amazon offers a suite of analytics tools that can help you uncover key insights and find ways to facilitate future growth.
Find Ways to Boost Conversion Rates and Customer Satisfaction
- Start your campaigns early: As an Amazon seller, it is crucial to increase your conversion rate. If potential customers view your listings but don’t buy anything, it could negatively impact your organic keyword ranking and Best Sellers Rank.
It’s best to start ad campaigns 2-3 weeks before Prime Day, as many people search for products and deals during this time.
However, conversion rates may decrease in the days leading up to the shopping event. This is because customers are researching products early and waiting to buy once the event starts. - Improve sales velocity: Prime Day promotional deals and sales present great opportunities that can help you increase your revenue. To measure and optimize your sales velocity on Prime Day, consider these questions:
- How many units did you sell?
- Were your targeted keywords highly searched in relation to your sales?
- Boost sales on Buy Box wins:
- To ensure success on Prime Day, keep these Buy Box tips in mind:
- Make sure you have enough stock to avoid losing the Buy Box and hurting your percentage.
- Keep your product listings active at all times to avoid missing out on Buy Box rotation.
- Amazon Seller Central displays two “Buy Box Wins” values. One shows your Buy Box percentage over the past two days, while the other shows for a 30-day period.
- Winning the Buy Box is crucial for maximizing your sales on Amazon, especially during Amazon Prime Day. Eighty-two percent of sales on Amazon are made via the Buy Box, and this percentage is even higher for mobile purchases.
- To ensure success on Prime Day, keep these Buy Box tips in mind:
- Reduce Cart Abandonment: Consider implementing these three easy tips to reduce the number of abandoned carts on your Amazon product page.
- Provide accurate and detailed product descriptions with materials, dimensions, weight, and popular uses.
- Offering free shipping can increase sales and improve customer satisfaction. Research shows that over 60% of shoppers would not have made their most recent online purchase if they had to cover the shipping cost.
- Respond accurately and promptly to customer complaints on Amazon’s product page to increase the likelihood of a successful sale.
Sifted Marketplace Intelligence is a Must-Have for Amazon Prime Day
Amazon sellers need to monitor their performance KPIs to keep their account in good health and improve their sales performance. But it’s difficult for Amazon sellers to find, track and monitor their key metrics in Amazon Seller Central without having to manually download, compile and manipulate dozens of individual reports to get the answers and insights they need.
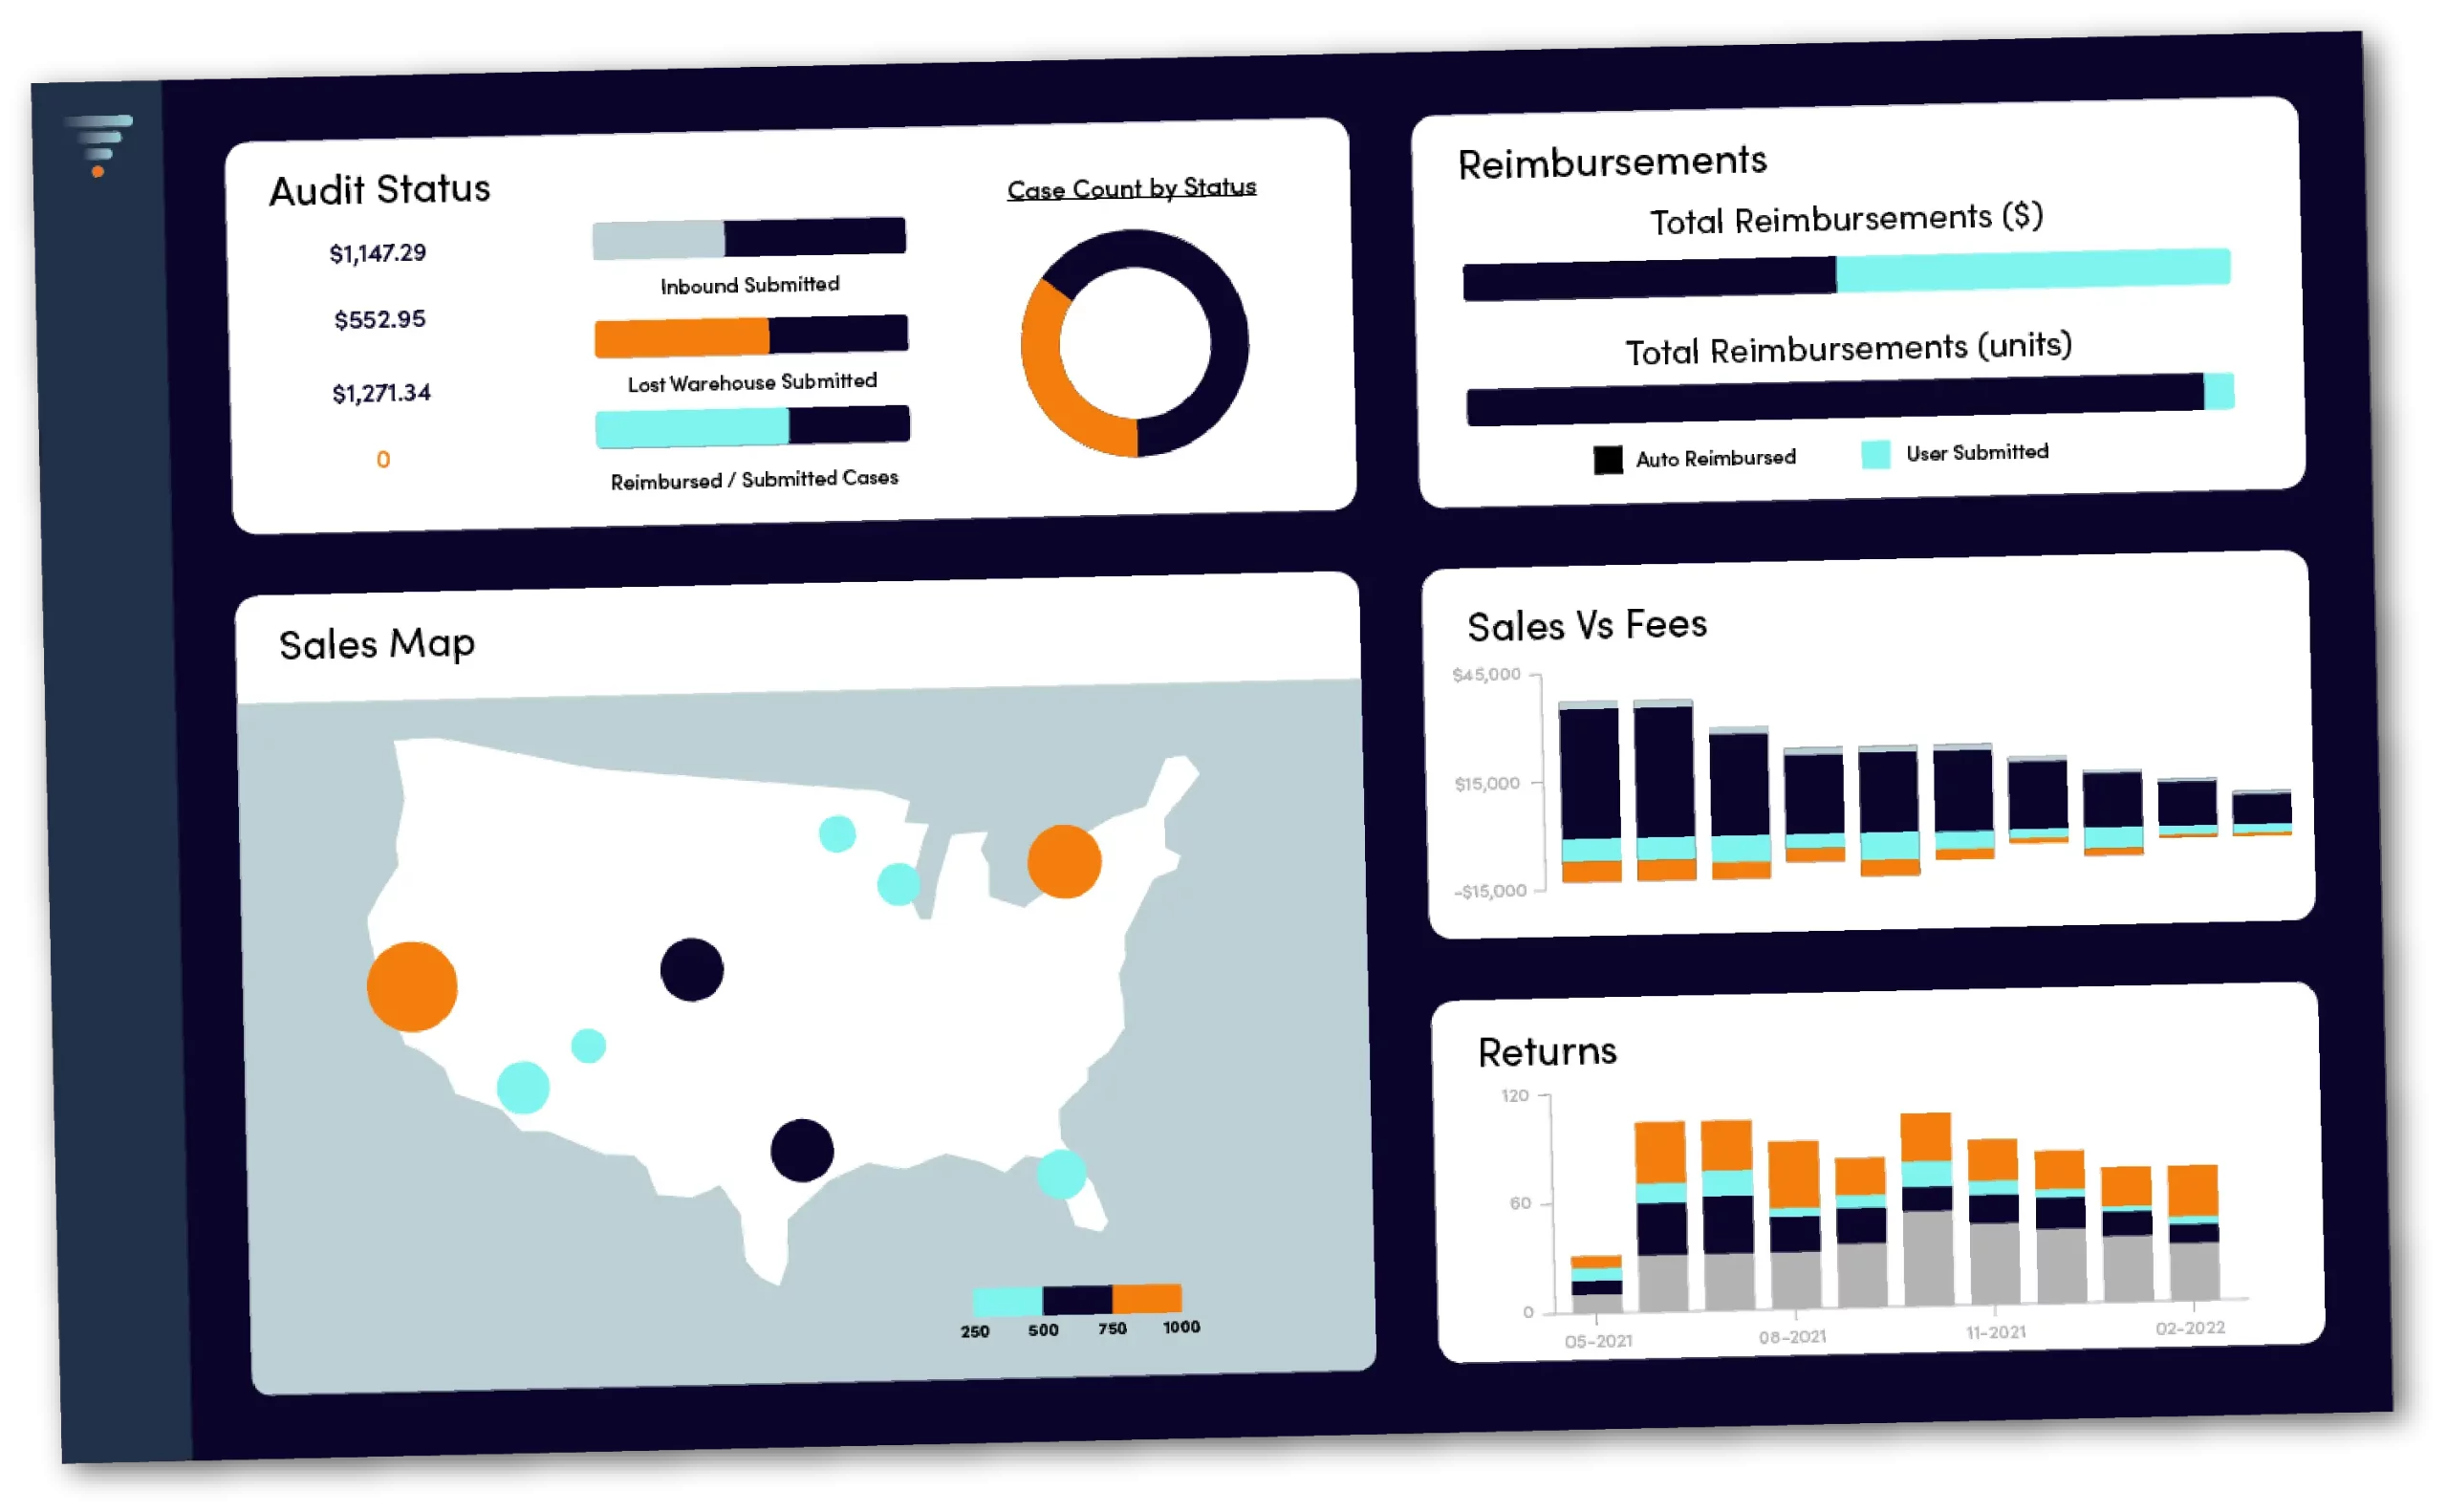
Sifted Marketplace Intelligence is an Amazon-focused solution that helps sellers prepare and optimize before, during, and after Prime Day. Here’s a look at Sifted’s tools for monitoring KPIs, improving performance, and increasing profits on Amazon:
- Fee Analysis: Helps you keep track of increased or incorrect fees on every SKU so you can reconcile and recover reimbursements for errors.
- SKU profitability metrics: Shows you which SKUs are your most profitable so you can promote and sell accordingly.
- Sales Heatmap: Pinpoints your customer order data geographically so you know exactly where your sales are coming from and can optimize accordingly.
- FBA Audit + Reimbursement Recovery: Audits your FBA shipments and inventory for errors to reconcile and recover reimbursements.
Get the data, insights and tools you need to recover losses and boost your profits on Amazon. Sign up for Marketplace Intelligence for free!


