PROFILE MONITORING
Track and Control Every KPI—Across Every Carrier
Your shipping data is telling you something. Can you hear it?

You can’t see the full picture.
Multiple carriers. Multiple portals. No single view across all of them.
Cost spikes show up weeks late.
Accessorials creep. Surcharges shift. By the time you spot it, it’s been compounding.
Reports take half the week.
Your team pulls data instead of acting on it. By the time it’s ready, it’s outdated.
Take data visibility to the next level.
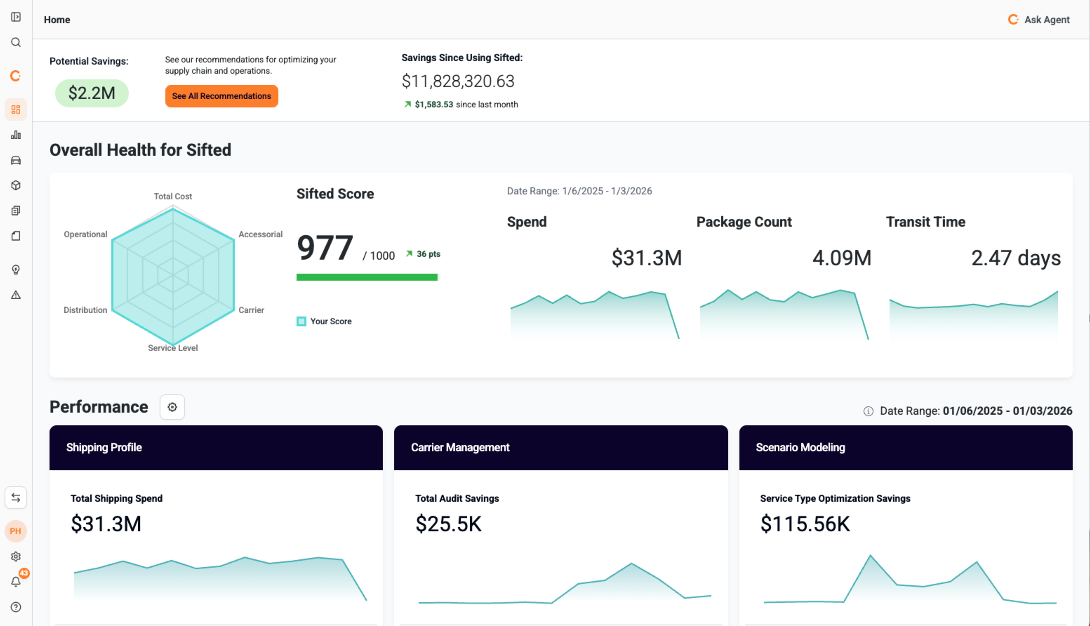
SIFTED SCORE
Know where you stand and where to focus.
Think of it as a health score for your shipping operation. Six categories, updated weekly, so you always know which lever to pull next.
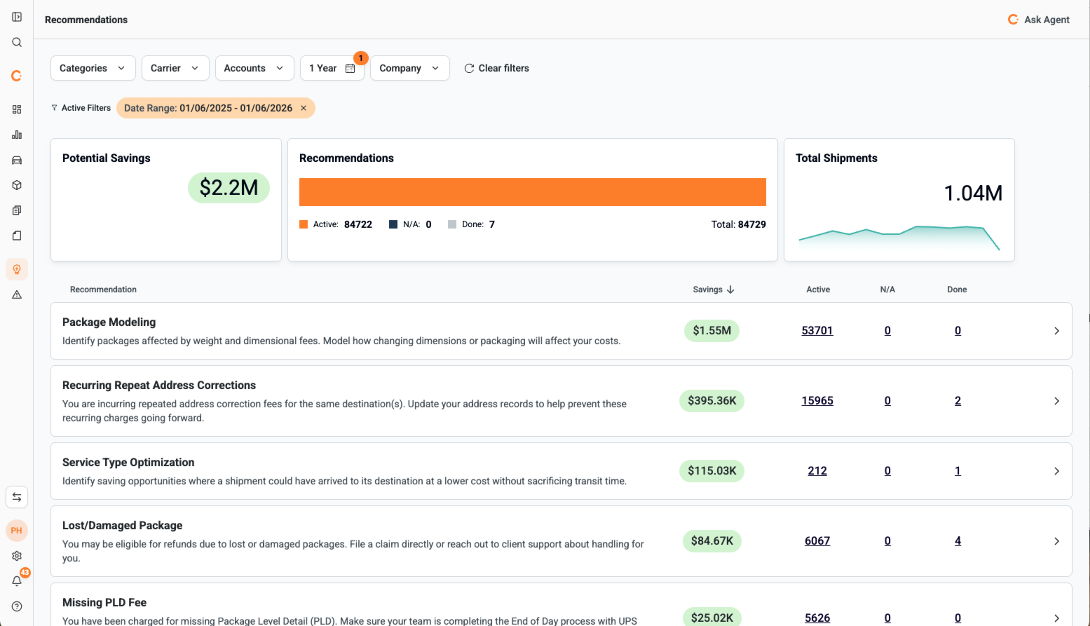
RECOMMENDATIONS & NOTIFICATIONS
Stop sifting through data. Start acting on it.
SiftedAI monitors your spend, carriers, and contracts—notifying you only when action is needed or savings opportunities arise.
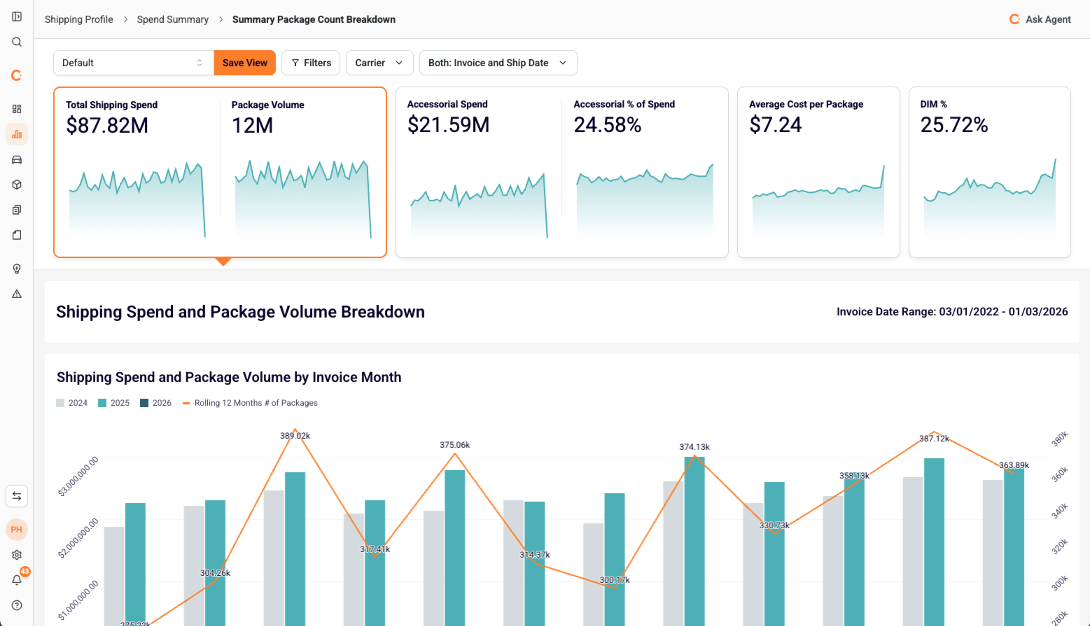
SPEND SUMMARY
See where every dollar goes—across every carrier.
Always-on dashboards breaking down volume, spend, accessorial charges, DIM weight impact, and more.
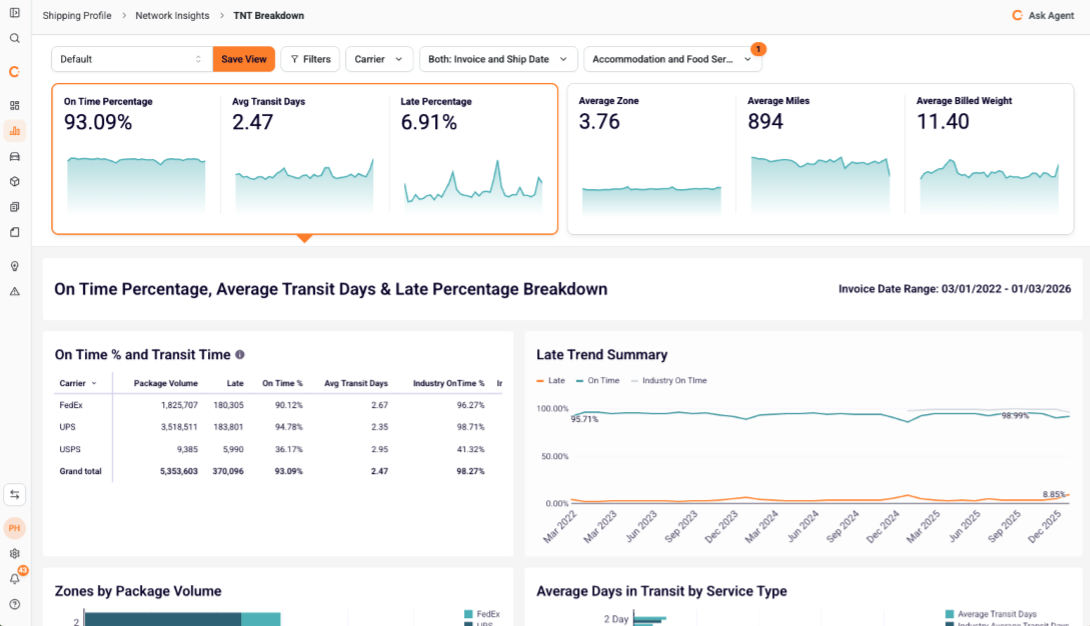
NETWORK INSIGHTS
Compare carrier performance, not just cost.
A comprehensive view of your distribution network: transit times, on-time percentages, service types, and average zones.
Verified G2 User in Retail | Enterprise (1000+ emp.)
Verified G2 User in Consumer Goods | Enterprise (1000+ emp.)


Common Questions
What is the Sifted Score?
How many carriers does Sifted support?
How long does it take to get connected?
How is this different from my carrier’s own reporting?
Will Sifted tell me what to do, or just show me data?
Have more questions or need more information? We’re here to help!