REPORTING AND ANALYTICS
The Parcel Data You Need, How and When You Need it
Centralize insights, visualize trends, and forecast what’s coming—across every carrier, in one place.
Reports shouldn’t take half your week.
Most teams pull data instead of acting on it. By the time the numbers are ready, the moment to act has passed.
Standard reports don’t fit your business.
Out-of-the-box dashboards rarely match how you measure performance, leaving teams in spreadsheets, not in action.
Rate hikes hit before you can react.
GRIs and demand surcharges sneak up. Without forward-looking analysis, you’re reacting to charges instead of planning for them.

Your data lives in different systems.
Parcel in one system, ERP in another, LTL in a third. No single view means no clean decisions.
See what’s happened, but more importantly what’s coming next.
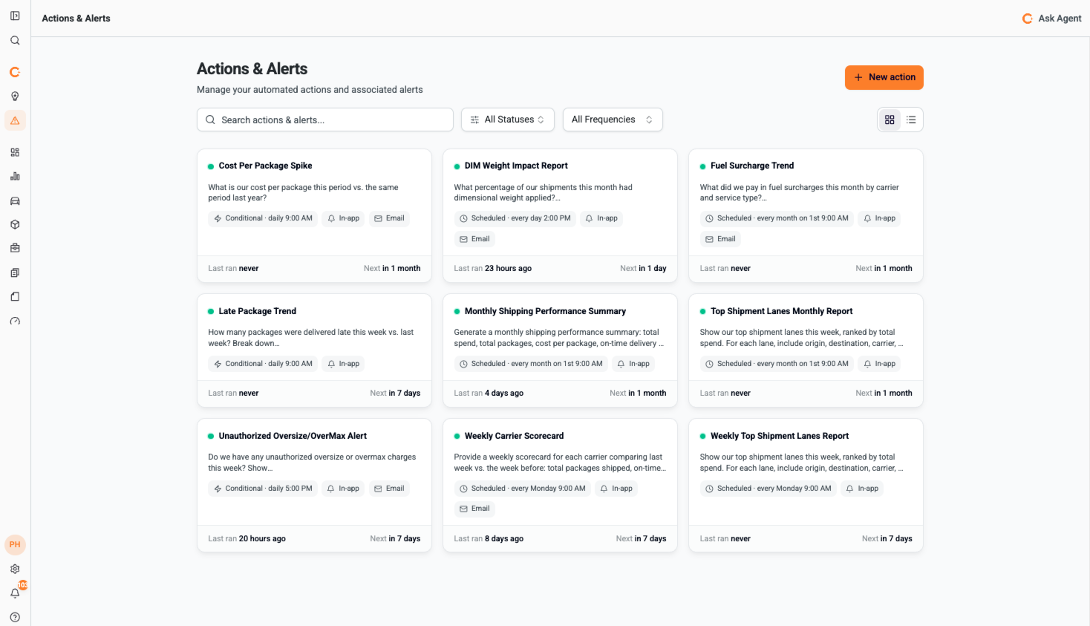
AUTO COPILOT ACTIONS & ALERTS
Automate the reporting tasks that eat up your team’s time.
Set up an action once—define what to analyze, how often, and when to notify you—and get the insights on your schedule.
Automatically generate recurring reports
Choose to be notified only when something crosses a threshold
Recieve email or in-app alerts—whatever fits your workflows
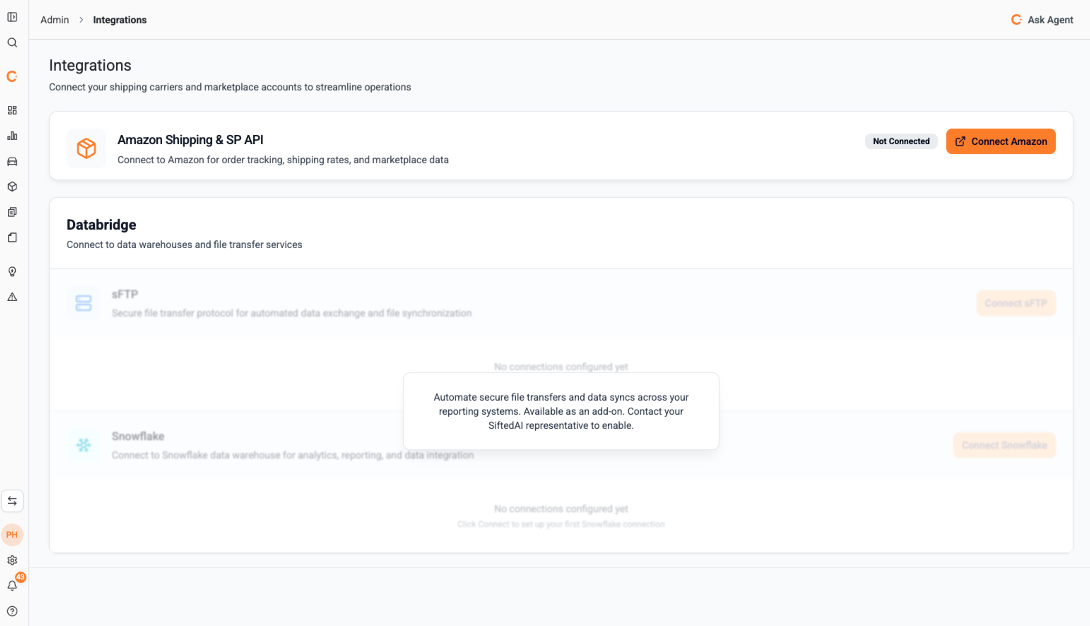
DATABRIDGE
Move clean parcel data into the systems you use daily.
Normalize, aggregate, and transfer your parcel invoice data into the systems your ERP, BI tools, data warehouses, etc.
Eliminate manual exports and reconciliation work
Keep finance, ops, and analytics teams on the same numbers
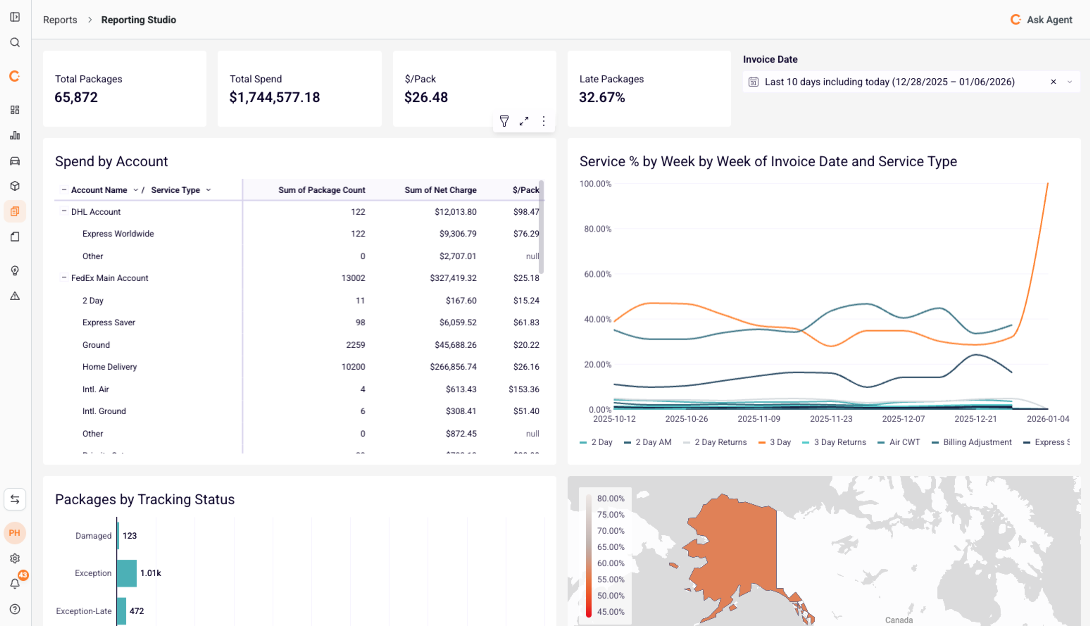
REPORTING STUDIO
Build the reports your business actually runs on.
Create visualizations tailored to your business and import your own datasets for analytics that go deeper than standard dashboards.
Drag-and-drop report builder with custom visualizations
Import SKU, order, and customer data alongside parcel insights
Save, share, and schedule recurring reports across your team
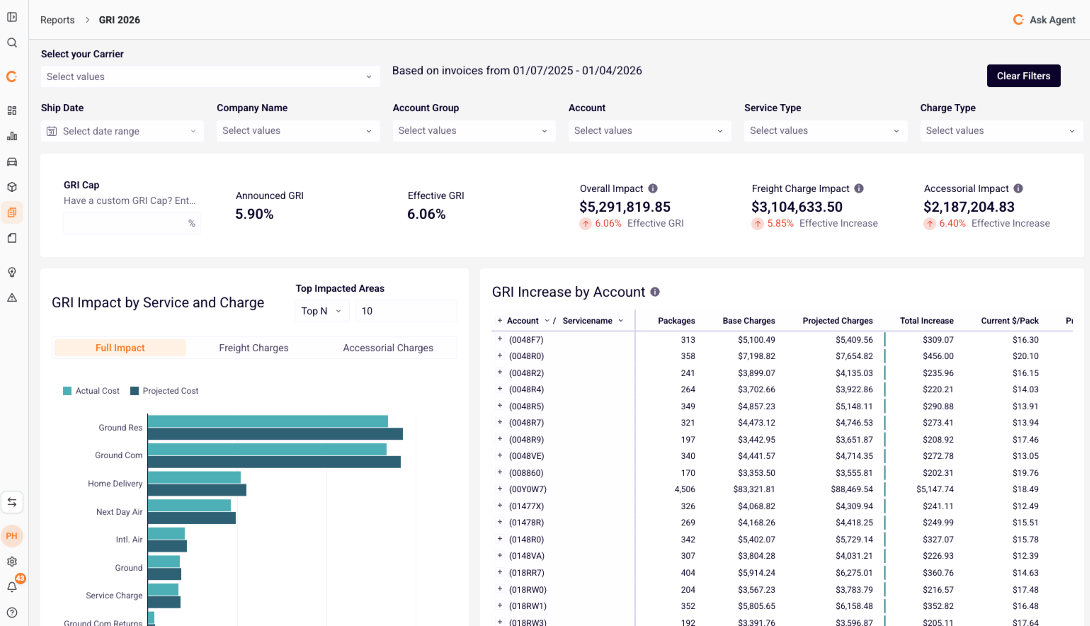
GRI & PEAK SEASON ANALYSIS
See the impact of rate increases before they hit.
See how new rates will affect your business, so you can plan, negotiate, or make adjustments before the costs land.
Quantify the dollar impact of GRIs on your shipping profile
Compare year-over-year peak surcharges by carrier & service
Use forecasts to negotiate from a position of evidence
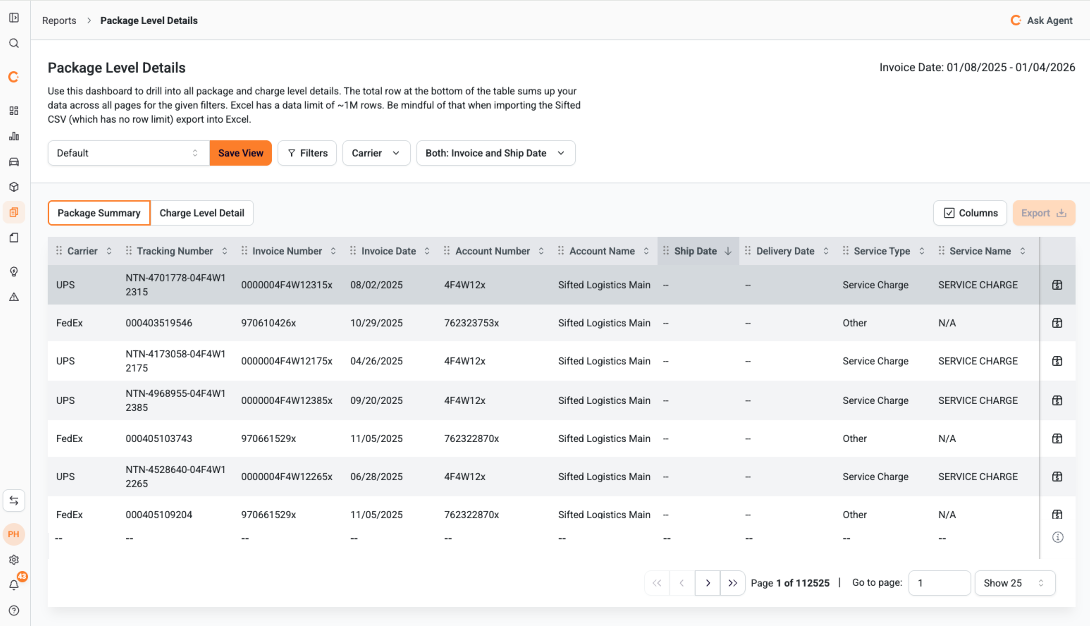
PACKAGE LEVEL DETAILS
Drill into the data without having to dig for it.
Filter your package and charge-level detail by company, mode, carrier, service, charge, and more—saving those filters for next time.
Filter and pivot across every line item, every invoice
Save and share filters with your team to rerun analyses easily
Access and export clean, normalized data
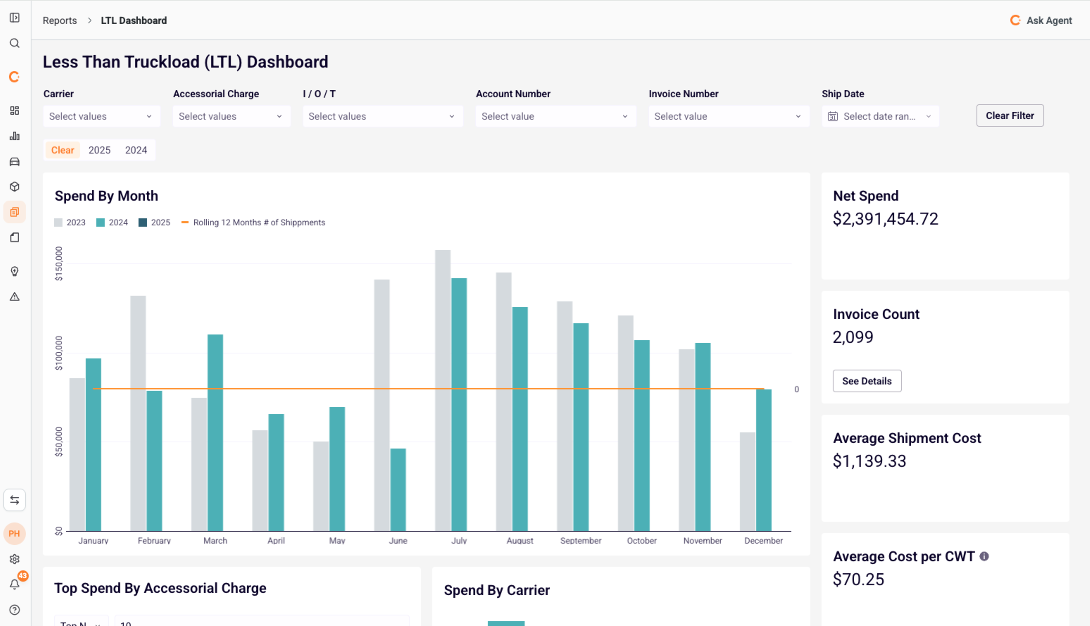
LTL DASHBOARD
One view across every LTL carrier.
Consolidates all your LTL invoices into one view. Compare carrier costs, track accessorial fees, and understand the impact of rebilled freight.
Compare carrier rates, accessorials, and on-time performance
Track rebilled freight and dispute opportunities
Roll up LTL spend alongside parcel for full network visibility
Verified G2 User in Retail | Enterprise (1000+ emp.)
Verified G2 User in Consumer Goods | Enterprise (1000+ emp.)


Common Questions
How is Reporting Studio different from out-of-the-box reports?
Out-of-the-box reports cover the basic analytics most shippers need: spend summary, network insights, package and charge details, GRI / peak season forecasts, etc. Reporting Studio is for everything custom: hyper-specific reporting (international free trends, carbon emissions analysis, and fuel expense trends), your own datasets imported alongside parcel data, and visualizations tailored to your business.
Can I bring my own custom data into Sifted?
Yes. Reporting Studio lets you import order data, SKU detail, customer information, and other internal datasets so you can analyze them alongside normalized parcel data in one place.
How does Databridge work with our ERP?
Databridge transfers your normalized parcel invoice data into the systems your team already uses—ERP, data warehouses, and BI tools. You choose the cadence, daily or weekly, and we handle the rest.
How long does implementation take?
Most clients are up and running within 24 hours of creating an account. From there, your dedicated Logistics Intelligence team member guides you through onboarding and training. If you add Databridge integrations, expect a bit of additional setup time.
Does Sifted handle LTL alongside parcel?
Yes. The LTL Dashboard consolidates LTL invoices and charges across carriers, so you can compare cost and performance and roll LTL spend up alongside parcel for full-network visibility.
Have more questions or need more information? We’re here to help!
Report on what matters most to your business.
Connect your carriers, see your data, and put the right reports in front of the right people.